
The average Harborough home hit £347,010 in July, up £27,107 in a year. That 8.5% rise is the fastest of the 35 East Midlands council areas, and eases off June.
The average home in Harborough district was worth £347,010 in July. That is £27,107 more than a year earlier, a rise of 8.5%.
No other local authority area in the East Midlands rose faster. We checked all 35 of them in the Land Registry’s data. North East Derbyshire came closest at 8.4%, then Derbyshire Dales at 7.1%. The region as a whole managed 1.9%. England managed 1.1%.
The figures come from the UK House Price Index, which HM Land Registry builds from completed sales rather than asking prices. The July index was published on Wednesday 16 September.
One caveat that matters before any of this is read as your own house price. UKHPI is a mean average, not a median. A handful of expensive sales in a small district pulls it upwards, and Harborough is a small district.
Harborough against its neighbours
| Area | Average price | Change over 12 months |
|---|---|---|
| Harborough | £347,010 | +8.5% |
| North West Leicestershire | £280,530 | +3.2% |
| Charnwood | £273,945 | +2.3% |
| Blaby | £289,282 | +1.9% |
| East Midlands | £242,274 | +1.9% |
| Hinckley and Bosworth | £260,187 | +1.7% |
| Melton | £282,521 | +1.5% |
| England | £293,479 | +1.1% |
| Leicester | £227,322 | -0.9% |
| Oadby and Wigston | £251,253 | -4.2% |
| Rutland | £298,916 | -6.5% |
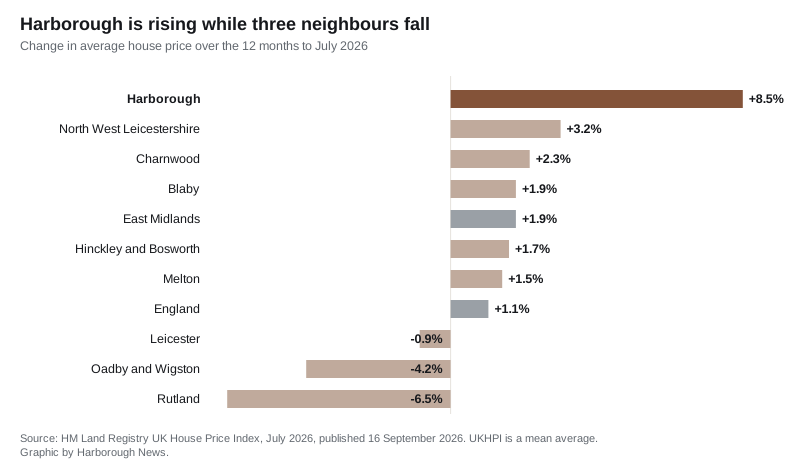
Three of the district’s neighbours are worth less than a year ago. Rutland, just over the Welland, is down 6.5%. Oadby and Wigston, which borders Great Glen, is down 4.2%.
Harborough is now the second most expensive place to buy in the East Midlands, behind Derbyshire Dales at £355,387. It sits £104,736 above the regional average and £53,531 above the England average.
Which homes are pulling it up
Semi-detached houses had the strongest year, not the big detached properties the district is known for.
- Semi-detached: £303,013, up 9.4%
- Terraced: £251,722, up 9.1%
- Detached: £478,422, up 8.2%
- Flats and maisonettes: £159,660, up 5.3%
That last line is the odd one. Flats are falling almost everywhere else. They are down 3.5% across England, 1.4% across the East Midlands, 4.4% in Leicester and 8.8% in Rutland. Harborough is the only district in Leicestershire, Leicester or Rutland where a flat is worth more than it was a year ago.
What a first-time buyer pays
The average first-time buyer purchase in Harborough district came to £278,406 in July, up 8.9% in a year. The England figure is £245,515.
A first home here therefore costs about £32,891 more than the England average, and more than the average home of any kind in England.
The rise is easing
The headline hides a turn. Annual growth in Harborough has come off its peak:
- June 2026: +10.0%
- July 2026: +8.5%
Month on month, July was almost flat, up 0.1% after a 0.3% dip in June. And the district was not always an outlier. In July 2025 the average price was £319,903 and the annual change was -0.1%, which is to say prices here were going nowhere. The whole gap with the rest of the region has opened up in twelve months.
Revision note. When we reported the June index on 19 August we gave the district average as £345,848, up 9.7%. The Land Registry has since revised June up to £346,695 and 10.0%. Revisions are normal in this series as late sales are registered, and we have added a note to that article.
What it means for you
- If you are selling, the index counts completed sales and lags the market by roughly two months. A July figure reflects deals agreed in the spring.
- If you are buying, the type matters more than the headline here. A semi has risen faster than a detached house in the last year, and flats are the only category still priced below £200,000.
- If you are budgeting, these are prices, not council tax. Bands were set on 1991 values and do not move with the market. Ours are listed on our Market Harborough council tax bands page.
- We keep the running district figures on our Market Harborough house prices page.
Source: HM Land Registry UK House Price Index, July 2026, published 16 September 2026, Open Government Licence. Comparisons drawn from the same release for every local authority area in the East Midlands.
Have your say