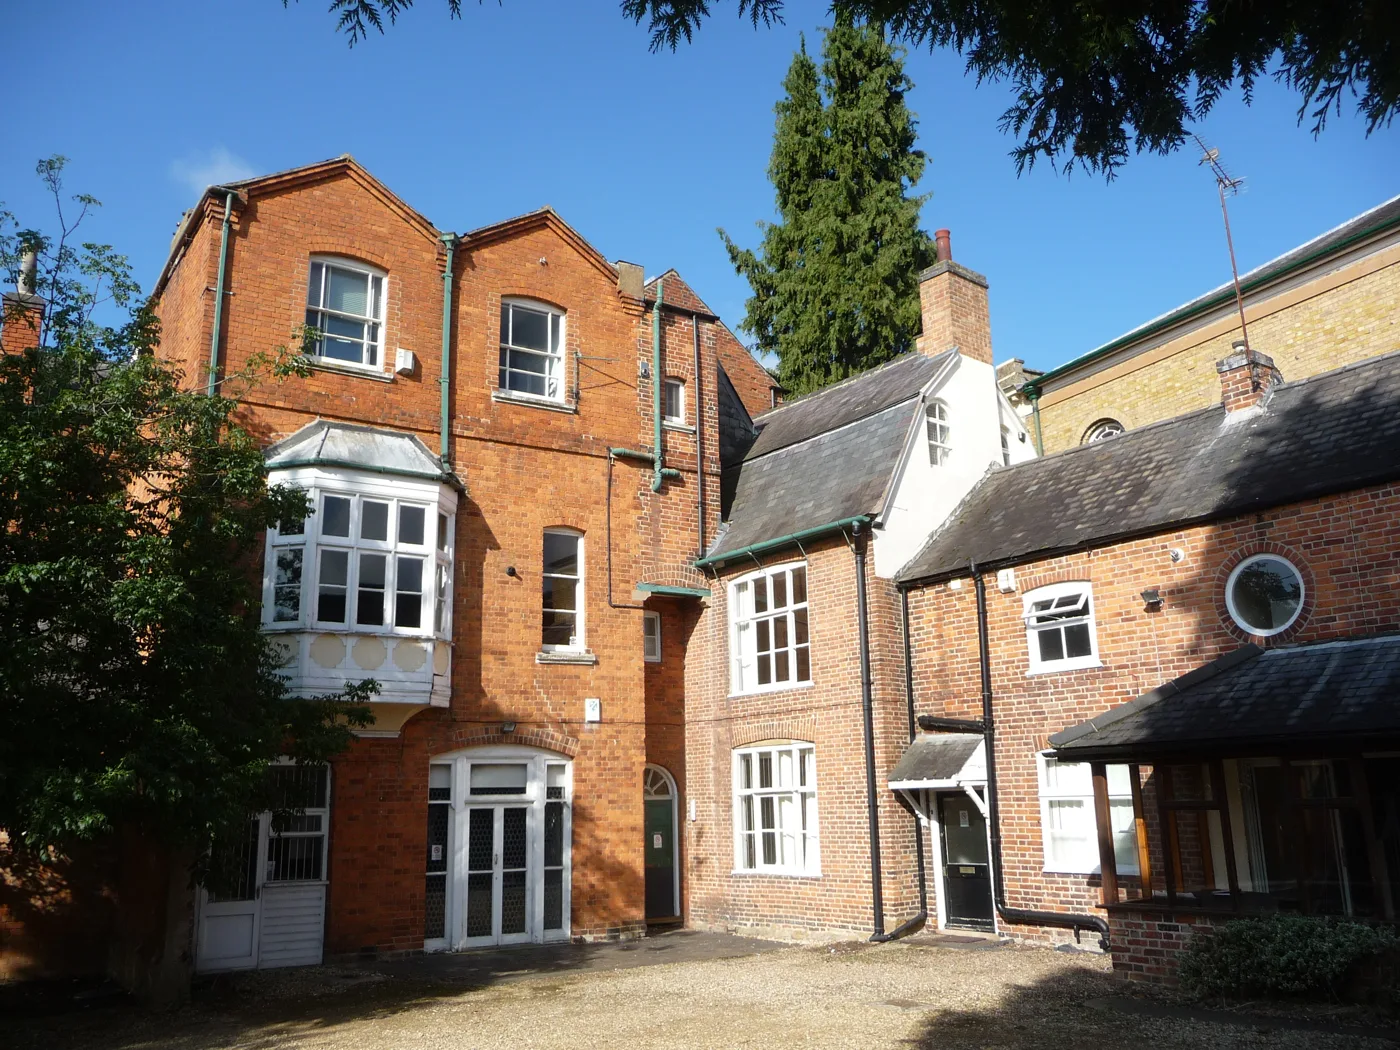

The typical home sold in Market Harborough went for £309,000 over the past year, below the £346,000 district average. Prices by type, and why the small villages cost most.
Two numbers get quoted for house prices here and they measure different things. The official Harborough district average is £346,000. The typical home actually sold in Market Harborough itself went for £309,000. Both are right. The district is far bigger than the town, and this is a district where the smallest villages are the dearest places in it.
This page gives both figures, says where each comes from, and breaks the year’s sales down by property type and by parish rather than by postcode, because not one of the four postcode districts covering Harborough lies wholly inside it.
The district figure
The average home across Harborough district sold for £346,000 in May 2026, up 7.1% on the £323,000 recorded a year earlier. That is the provisional figure from the UK House Price Index, built from completed HM Land Registry sales rather than asking prices and adjusted for the mix of homes sold.
For context, the East Midlands average was £241,000 and the UK average £271,000 in the same month. Harborough sits about £105,000 above its own region, and on this measure it is the second most expensive district in the East Midlands, behind Derbyshire Dales. A 7.1% year is also well ahead of the regional and national pace.
The town figure
Narrow the lens to Market Harborough and the number comes down. Of the 389 residential sales in the town that HM Land Registry had registered for the year to 31 July 2026 when we checked on 9 August, the median price paid was £309,000 and the mean was £338,513.
“The town” here means a real boundary, not a postcode. Market Harborough is an unparished area, so every sale in these figures sits inside the town’s own administrative area. We took every sale in the LE16, LE17, LE8 and LE9 postcode districts, looked each postcode up to find which council area and which parish it falls in, and kept the ones that are genuinely Harborough. That matters here more than in most places: LE16 also covers parts of North Northamptonshire, Rutland and West Northamptonshire, LE17 reaches into Blaby, Rugby and West Northamptonshire, LE8 into Blaby and Oadby and Wigston, and LE9 into Blaby and Hinckley and Bosworth. A raw LE16 figure is not a Market Harborough figure.
Across the whole of Harborough district on the same basis, 1,094 sales produced a £310,000 median and a £374,848 mean. The gap between that £310,000 and the index’s £346,000 is method, not disagreement: one is a plain middle-of-the-sales number, the other is mix-adjusted and pulled up by a long tail of large detached houses.
Market Harborough prices by property type
Land Registry records every completed sale with its property type, so the town’s year splits cleanly.
| Property type | Sales | Share | Median | Mean |
|---|---|---|---|---|
| Detached | 145 | 37.3% | £415,000 | £440,265 |
| Semi-detached | 97 | 24.9% | £310,000 | £319,940 |
| Terraced | 88 | 22.6% | £250,000 | £254,793 |
| Flats and maisonettes | 51 | 13.1% | £167,500 | £173,685 |
| Other | 8 | 2.1% | £340,000 | £691,187 |
| All types | 389 | 100% | £309,000 | £338,513 |
The detached house is the biggest single slice of the Market Harborough market at 37%, which is unusual for a town centre and says something about how much of the town is post-war estate rather than Victorian terrace. Its £415,000 median is the number most people mean when they say the town has got expensive.
The £250,000 terraced median is the real entry price for a house here, and the £167,500 flat median is the only route in much below a quarter of a million. Flats are 13% of what sold, so that route is narrow.
One oddity worth flagging: the town’s semi-detached median of £310,000 is higher than the district-wide £285,000, and it is within £5,000 of the district’s all-types median. A semi in Market Harborough is not the cheap option it is in most Leicestershire towns.
The small villages are the expensive part
This is the fact that catches people out. Distance from the town does not set the price here. Size does, and it does it sharply.
The 47 parishes with fewer than 15 sales each between them recorded 174 sales at a £460,000 median and a £551,044 mean. Those are hamlets and estate villages where a handful of large houses change hands each year, and they are £151,000 above the town. Bruntingthorpe (8 sales, £715,000 median), Foxton (6, £657,500), Great Easton (5, £575,000) and Medbourne (9, £530,000) sit at the top of that group.
The larger villages go the other way. Pooled, the eight parishes that recorded 15 or more sales came in at £298,000, below the town.
| Parish | Sales | Median |
|---|---|---|
| Great Bowden | 16 | £467,500 |
| Gilmorton | 19 | £500,000 |
| Kibworth Harcourt | 27 | £378,000 |
| Great Glen | 52 | £330,500 |
| Market Harborough | 389 | £309,000 |
| Broughton Astley | 124 | £287,075 |
| Husbands Bosworth | 17 | £285,000 |
| Lutterworth | 137 | £285,000 |
| Kibworth Beauchamp | 67 | £280,000 |
| Fleckney | 72 | £265,000 |
Broughton Astley, Fleckney and Kibworth Beauchamp are the district’s estate villages, all with substantial modern housing, and all cheaper than Market Harborough. Great Bowden sits immediately north of the town and is £158,500 dearer than it. The two Kibworths, which run into each other, are £98,000 apart.
Lutterworth is the cheapest town in the district
Lutterworth’s 137 sales produced a £285,000 median, £24,000 below Market Harborough. The gap is wider than it looks by property type: a detached house in Lutterworth had a £355,000 median against £415,000 in Market Harborough, and a terrace £213,500 against £250,000. Only two flats sold there all year, so there is effectively no flat market.
Lutterworth is the district’s second town and about half Market Harborough’s population, and its housing stock skews newer. It is also the town with a motorway junction rather than a fast London train, which is worth weighing if you are choosing between the two.
Who is buying, and at what
The UK House Price Index splits the district’s buyers, and every category rose at close to the same rate, which is the signature of a market moving in one piece:
- First-time buyers paid an average of £277,561 in May 2026, up 7.2% on the year.
- Home movers paid £404,383, up 7.1%.
- Mortgage buyers averaged £350,255 and cash buyers £337,111, up 7.2% and 7.0%.
By property type across the district: detached £477,800, semi-detached £302,562, terraced £250,201, flats £159,791. Semis rose fastest at 8.1% over the year; flats were the laggard at 3.7%.
Renting has moved differently. The average private rent in Harborough was £962 a month in June 2026, up 2.9% from £935. Rents rising at less than half the pace of prices is unusual, and it means the sums on buying versus renting have shifted against buying over the past year.
What it means for you
If you are selling, 7.1% is a strong year by recent standards and well ahead of the region. Semis have had the best of it. Flats have had the worst, and a flat priced off 2025 comparables will sit.
If you are buying, the decision that costs real money here is not town versus country, it is which kind of village. The larger estate villages come in below the town; the small ones are £150,000 above it. Broughton Astley, Fleckney and Kibworth Beauchamp are the places where the money goes furthest, and Lutterworth is cheaper than Market Harborough on every house type.
Either way, check what is coming next door before you commit. The district has a new Local Plan at examination that allocates 1,350 homes in Market Harborough alone, and our planning page sets out where they go. If you are buying to commute, the train to London from Market Harborough is 58 minutes at its fastest, which is a large part of why the town costs what it does.
Frequently asked questions
What is the average house price in Market Harborough?
The median sold price in the town was £309,000 across 389 sales registered in the year to 31 July 2026. The wider Harborough district average was £346,000 in May 2026 on the UK House Price Index, which is mix-adjusted and covers a much larger, more rural area.
Are house prices in Harborough going up?
Yes, and faster than the region. The district average rose 7.1% in the year to May 2026, from £323,000 to £346,000. The East Midlands as a whole averaged £241,000 in the same month.
How much is a terraced house in Market Harborough?
The median terraced sale in the town was £250,000 over the past year, from 88 sales. Terraces are 23% of everything sold. A flat, at a £167,500 median, is the only cheaper option.
Is Market Harborough expensive compared with the rest of the district?
It is mid-priced. The small villages are far dearer, at a £460,000 pooled median. The larger villages, including Broughton Astley, Fleckney and Kibworth Beauchamp, are cheaper than the town, and so is Lutterworth at £285,000.
Why is Harborough the priciest district in the East Midlands?
The UK House Price Index average for Harborough is £346,000 against £241,000 for the East Midlands. The district combines a fast commuter line to London from Market Harborough with a large number of small, heavily detached villages and no low-value urban area to pull the average down.
Where can I check what a specific house sold for?
Every completed sale in England and Wales is public. Look up a street or an address for free on HM Land Registry Price Paid, or browse the same data on Rightmove and Zoopla.
Sources
- UK House Price Index, Harborough (ONS and HM Land Registry) for the district average, annual change, property-type, buyer-type and rent figures and the regional and UK comparisons, May 2026 provisional (rent June 2026).
- HM Land Registry Price Paid Linked Data queried on 9 August 2026 for every residential sale registered in the LE16, LE17, LE8 and LE9 postcode districts between 1 August 2025 and 31 July 2026. Each sale was matched to its council area and parish through postcodes.io before the medians, means and counts here were calculated, so only sales inside Harborough district are included.
- HM Land Registry Price Paid search to check any individual address.
Land Registry data is added to as sales are registered, so figures for the most recent months rise as more transactions come in. Medians are of registered sales, not of every home in an area, and parishes with only a handful of sales move a long way on one large house.
Have your say